Jack Li

Data analyst at Best Buy

Analytics, dashboards, statistics, machine learning and forecasting. I build the SQL models and reports that teams use to make decisions.

Projects

Dashboards and analyses built in Tableau, Python, SQL and Excel.

Featured

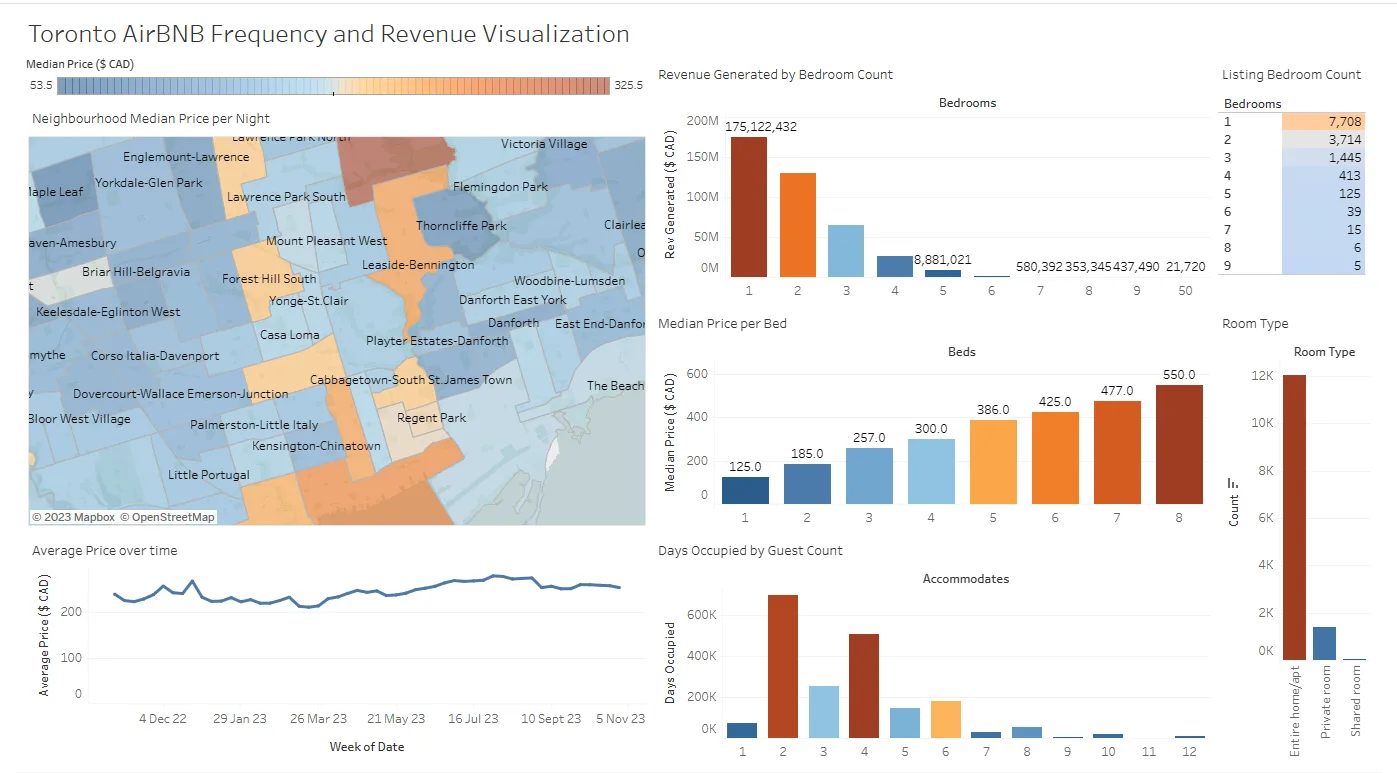
Toronto Airbnb popularity dashboard

An interactive map and dashboard of Toronto Airbnb listings. It shows which neighbourhoods, bedroom counts and room types are most popular, the median price per bed, how many guests listings take, and how prices move over the year. Cleaned and analysed in Python, visualised in Tableau.

  • Python
  • Tableau

Global COVID-19 visualization

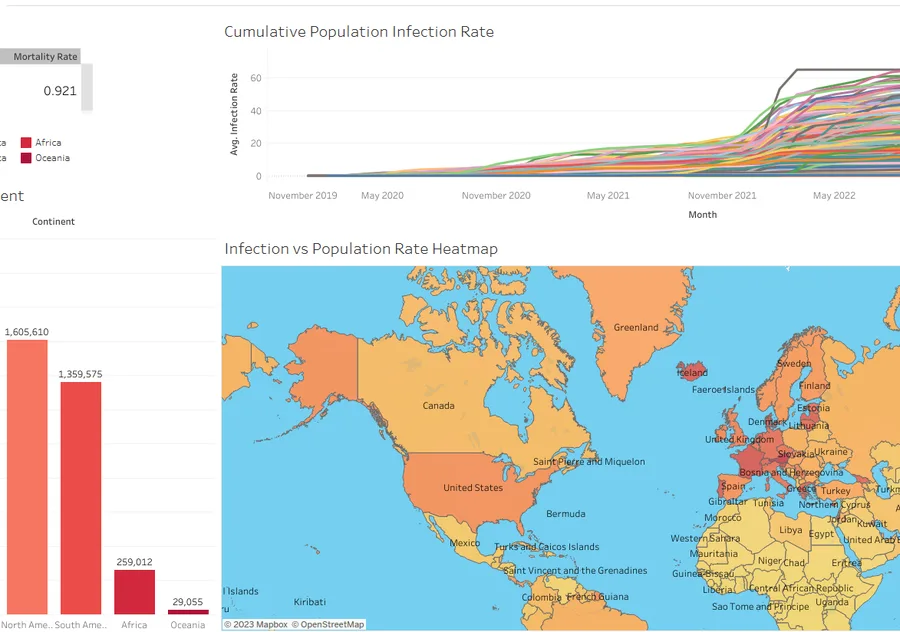
Infection, mortality and vaccination rates compared across countries, including how vaccination rate relates to mortality and infection. Data cleaned and explored first in SQL Server.

  • SQL Server
  • Tableau

Bike sales analysis

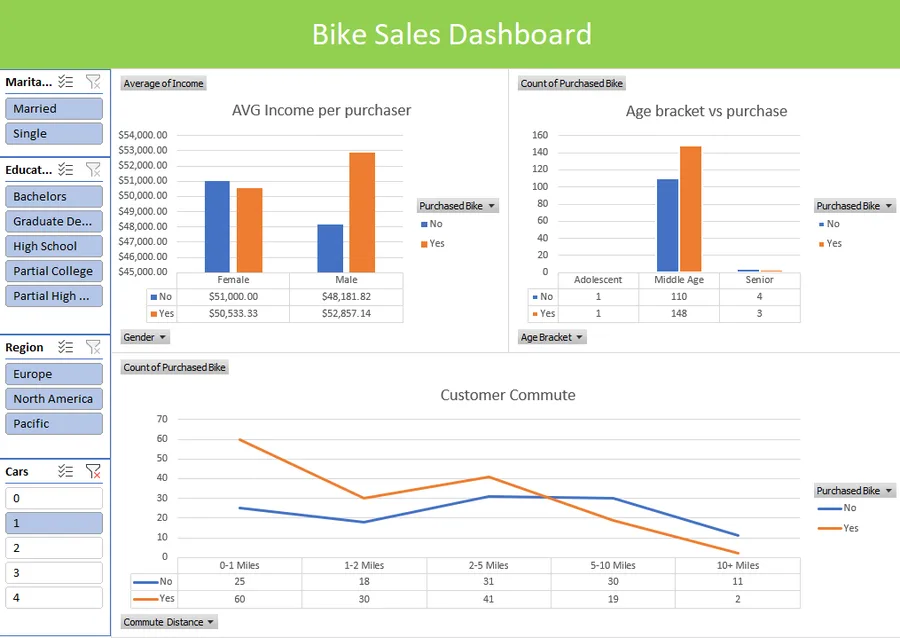
Who buys bikes in North America and Europe, broken down by marital status, income, children, age bracket and commute distance.

  • Excel

COVID-19 data exploration

Exploratory analysis of a global COVID-19 dataset: infection and mortality rates, total cases by country and continent, and vaccination rates. Also prepared the data behind the Tableau visualization.

  • SQL Server

Film industry analysis

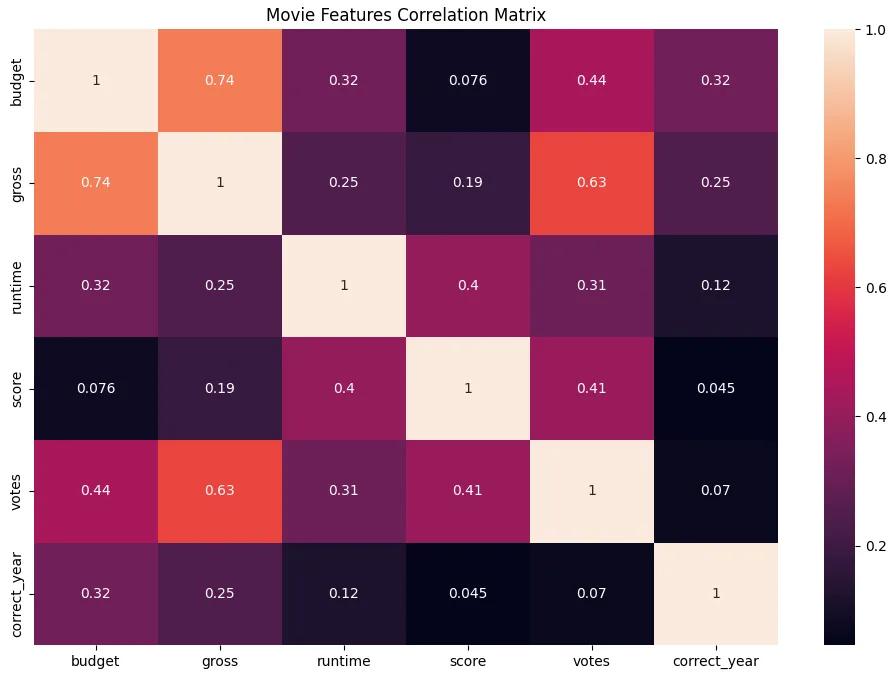
Which features of a film track with its gross earnings, using data scraped from IMDb. Cleaning, exploration and correlation analysis in a Jupyter notebook.

  • Python
  • Jupyter

WordNet vs SPP significance testing

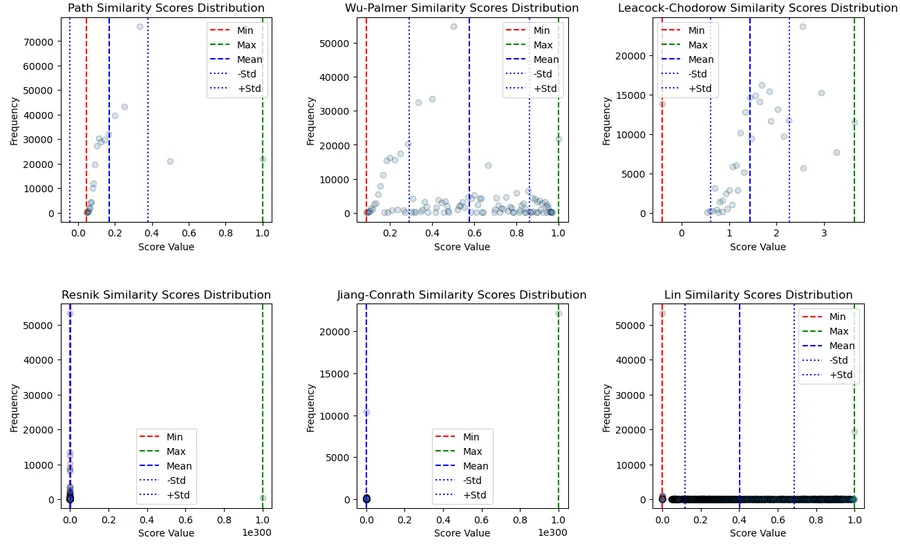
WordNet was built to model how people relate words, then became a staple of natural language processing. This project tests whether its similarity scores still match human word-relation data.

  • Python
  • statistics

More projects

Every Python, SQL, Excel, Power BI and Tableau project is on GitHub, and the dashboards are on Tableau Public.

Experience

Analytics and data science roles in retail, finance and mining.

  1. Mar 2026 – present

    Best Buy

    Intermediate Data Analyst

    Making reporting and delivery analytics faster, more reliable and more useful for decisions.

    • Optimized the SQL queries and data models behind critical reports, and modernized the reports themselves.
    • Analysed customer segments and delivery feasibility against carrier pricing, finding 18% of remote-area customers newly serviceable. This opened previously excluded regions and an estimated $5M in revenue by year end.
    • Ran difference-in-differences analyses across 30+ stores to test where registers should go to lift mobile activation revenue over the holidays.
    • Built same-day delivery cost and speed simulations from local carrier data, finding contract inefficiencies that informed negotiations.
  2. Apr 2025 – Feb 2026

    OneDataTree

    Data Developer Analyst

    Financial and customer forecasting, end-to-end reporting pipelines, and tools for catching problems early.

    • Built and maintained an automated ingestion and dashboard pipeline in Python, SQL and Tableau, cutting daily reporting time by 75% and report errors by 10%.
    • Forecast revenue with time series and regression models in Python, improving reporting accuracy by 15% and supporting budget decisions.
    • Developed a churn classification and customer lifetime value model that flagged high-risk customers for targeted retention, reducing churn by 7%.
    • Built and deployed an entity flow application tracking revenue, balance and spending for 50+ customer entities.
  3. Jan 2024 – Apr 2025

    OneDataTree

    Data Reconciliation Analyst

    Keeping data accurate, catching issues early, and giving product leadership the numbers they needed.

    • Built a cross-database validation report in SQL, Python and Excel comparing internal and client records, reducing discrepancies by 43%.
    • Designed weekly KPI dashboards on revenue, churn and product usage, so leadership could spot and act on trends within 24 hours.
  4. Aug 2021 – Jun 2022

    Teck Resources

    Data Scientist

    Core team member on the equipment failure classification models and the engine life cycle model for haul trucks, all deployed to production.

    • Cleaned data, ran exploratory analysis and reported statistical findings in Python and SQL, cutting daily reporting time by 22%.
    • Selected classification features with ElasticNet, improving precision, reducing overfitting and raising the failure detection rate by 16%.
    • Modelled equipment life cycles with regression to guide replace-or-maintain decisions, lowering maintenance costs by 14% and raising uptime by 10%.

About me

Hi, I’m Jack. I like finding the story in a dataset and explaining it so anyone in the room can follow.

I have an Honours B.Sc. in Statistics and Computational Cognitive Science from the University of Toronto, and a strong background in computer science. My favourite tools are Python, SQL, R, Tableau and Excel.

Away from work I play a lot of team sports, mostly volleyball and ultimate, plus casual badminton and table tennis. On weekends I am usually trying a new restaurant somewhere in the city or catching up on movies and games.

Skills

  • Python
  • SQL
  • R
  • Tableau
  • Power BI
  • Excel
  • Data cleaning
  • Data visualization
  • Statistics
  • Machine learning
  • Forecasting
  • Communication

Education

University of TorontoHonours B.Sc., Statistics and Computational Cognitive Science

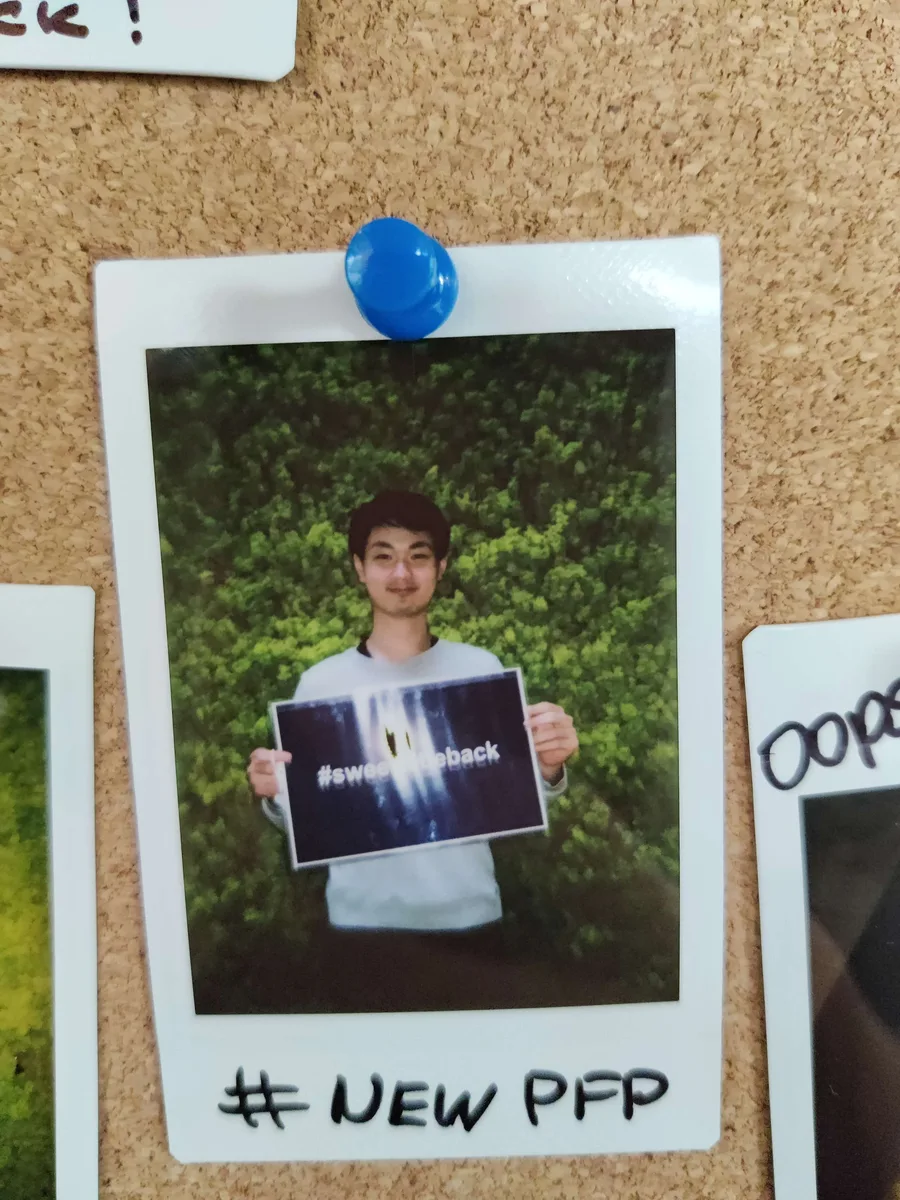
Jack in sunglasses, with a capybara resting in the grass behind himA polaroid of Jack pinned to a corkboard, captioned new profile pictureJack eating brunch at a restaurant table